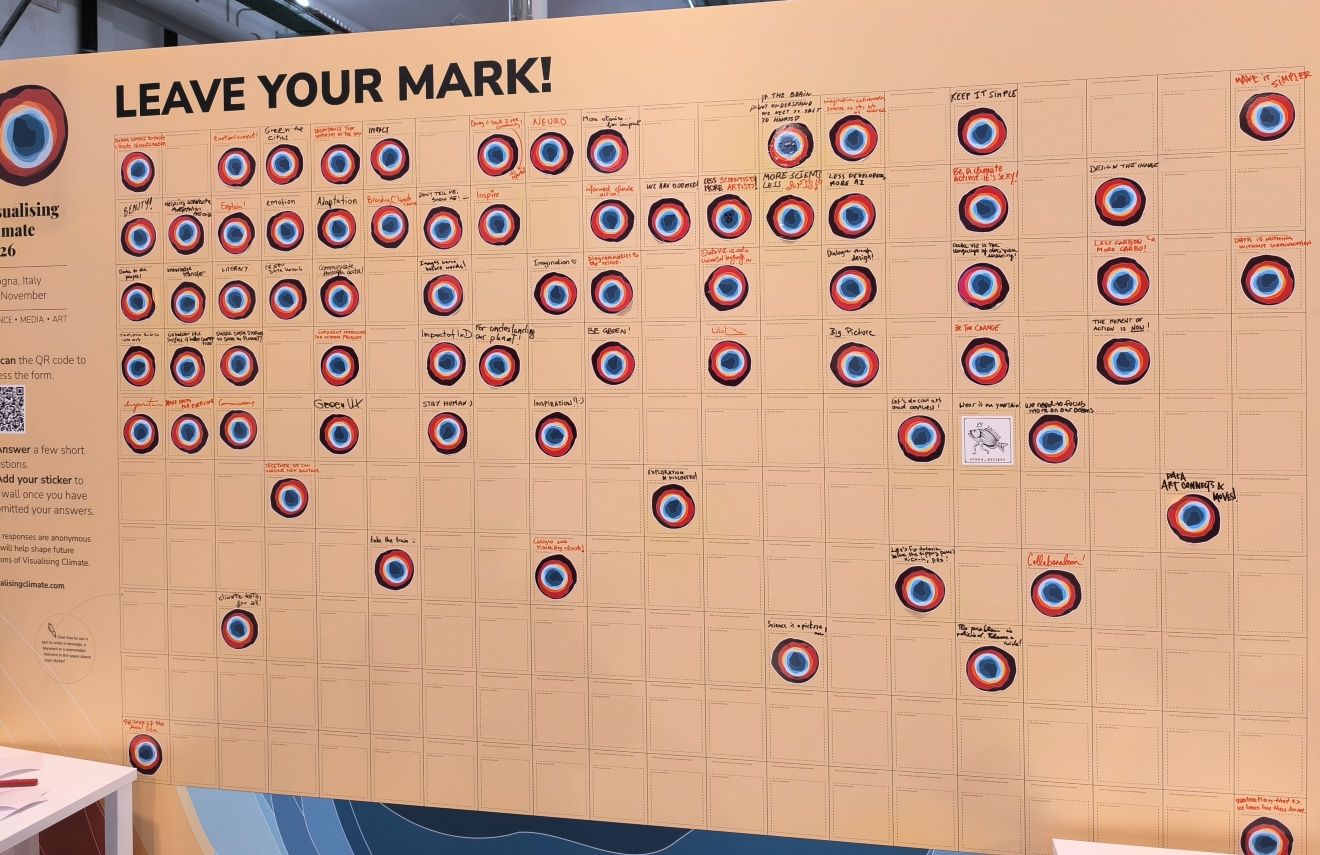
Reflections from Visualising Climate in Bologna

There is a long tradition connecting the city of Bologna with science.
This was one of the opening remarks at the Visualising Climate conference this week, giving space to science, media and arts. It turned out to be a strong combination!
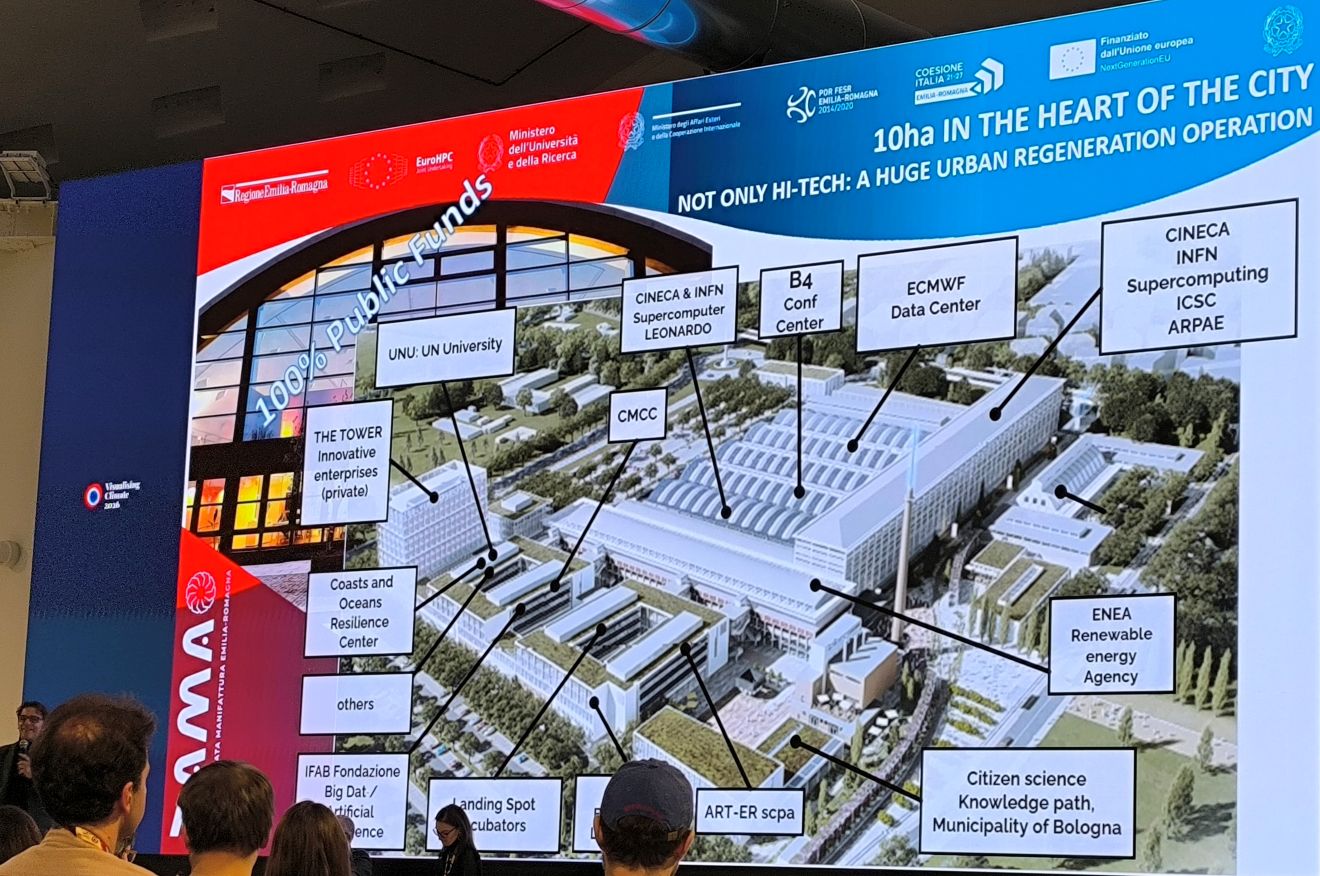
Here are some of the key themes and insights that I learnt this week:
Co-design matters #
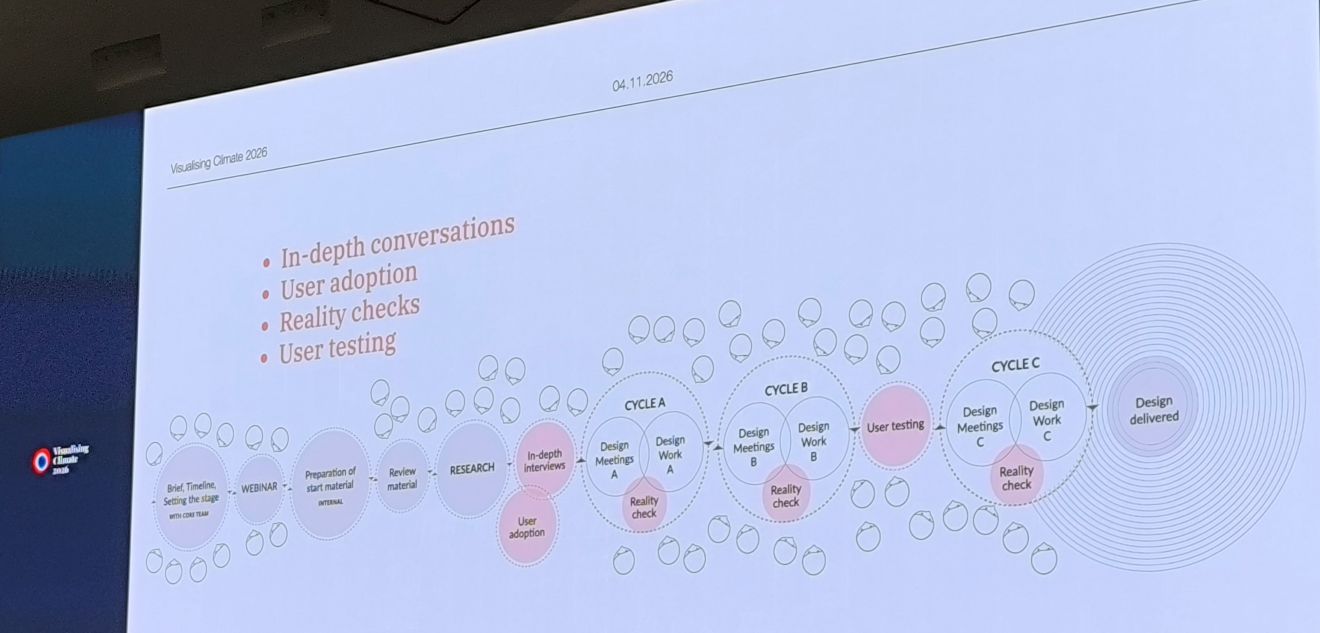
In her keynote, Hidden Legacy, Angela Morelli highlighted the importance of involving scientists in the design process and keeping the conversation on-going.
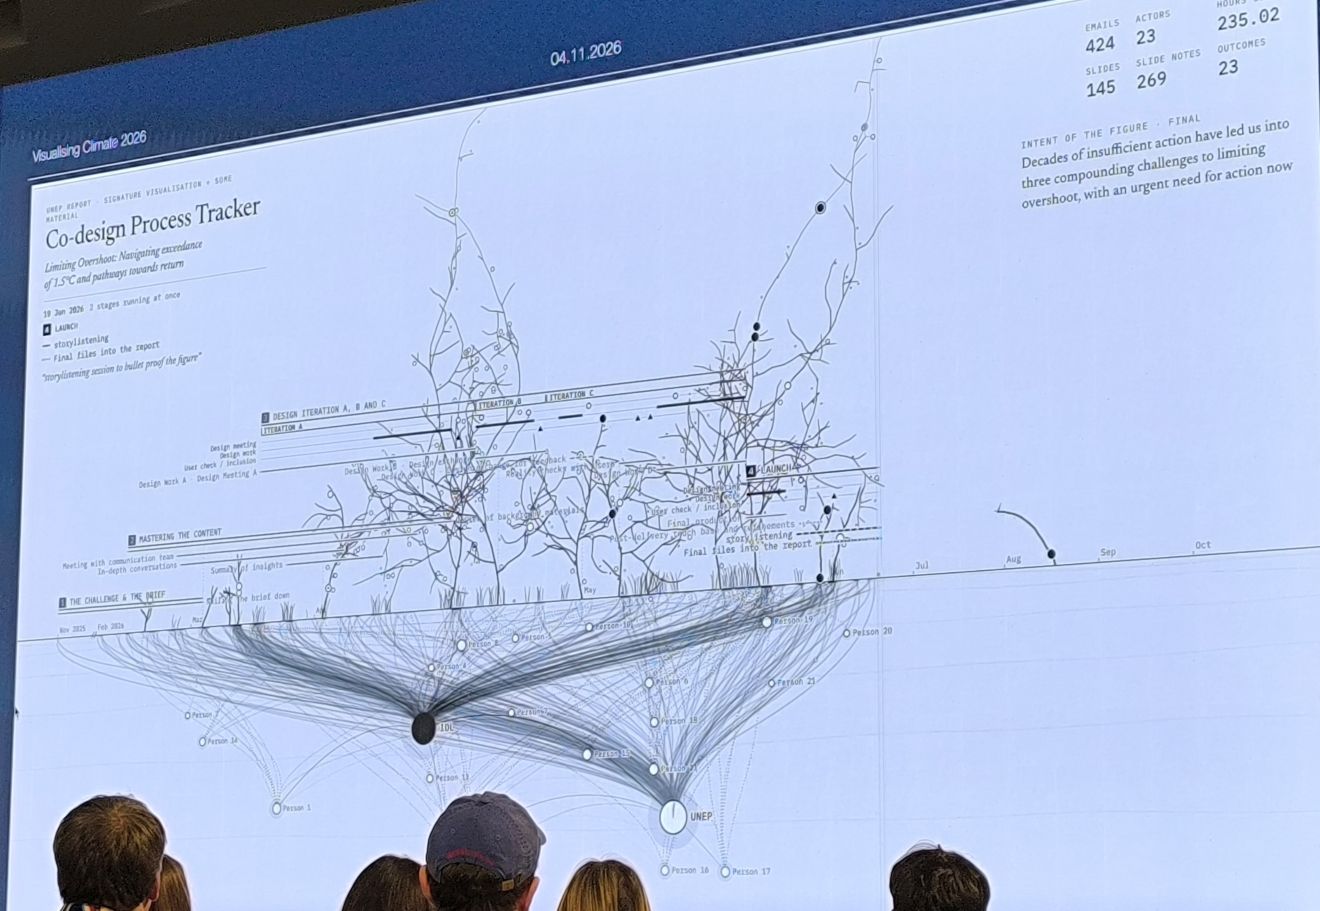
This idea of co-design came up again in several talks throughout the conference.
Make climate data personal #
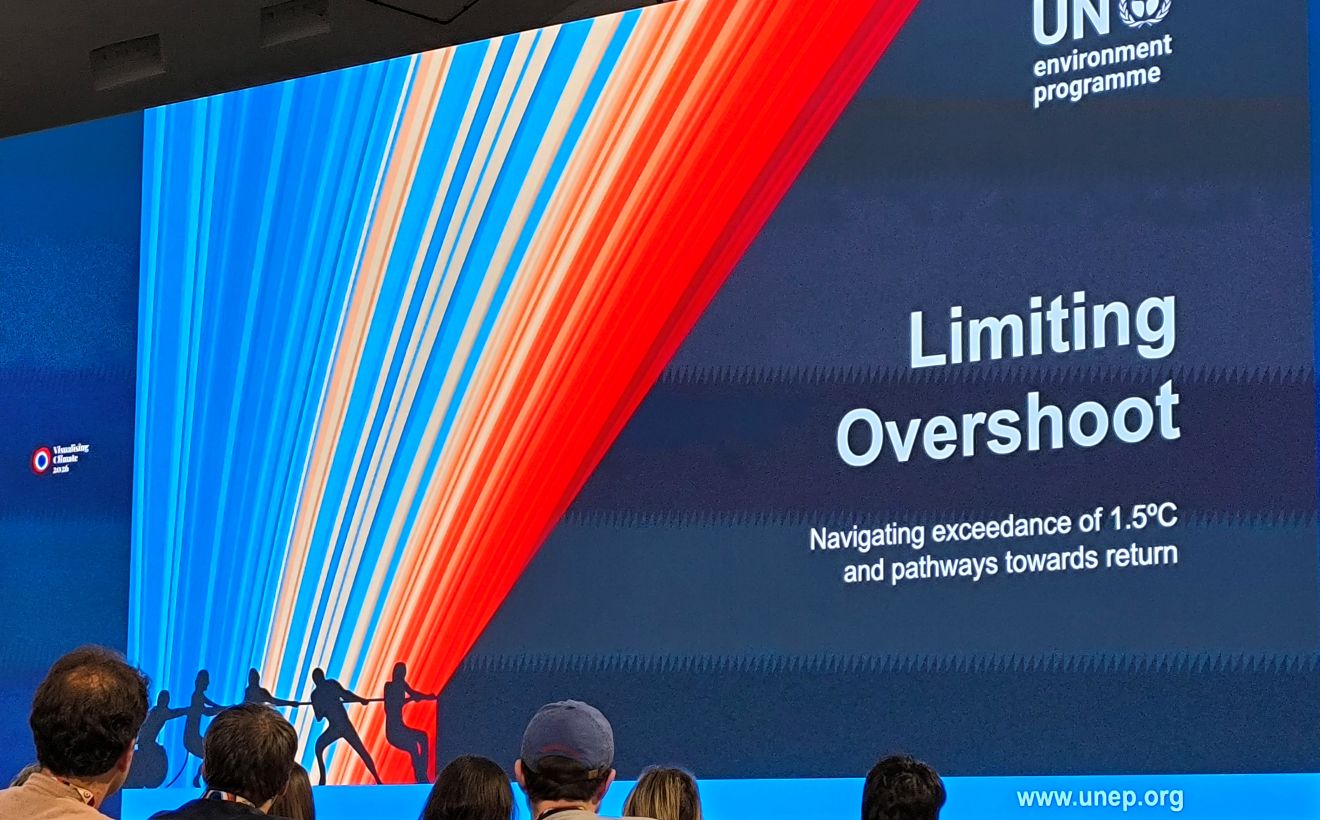
How do we make climate data relevant to people? One recurring message was the importance of connecting data to everyday lives and making it personal and relatable.
People are less likely to engage with information when it feels distant or too abstract. We need to find ways to translate complex scientific language into something more accessible, without losing its meaning.
Several presenters approached this challenge from their own unique perspectives. As Frédérik Ruys put it: “Let your story set the limits, not your technology!”
Data visualization can be art #
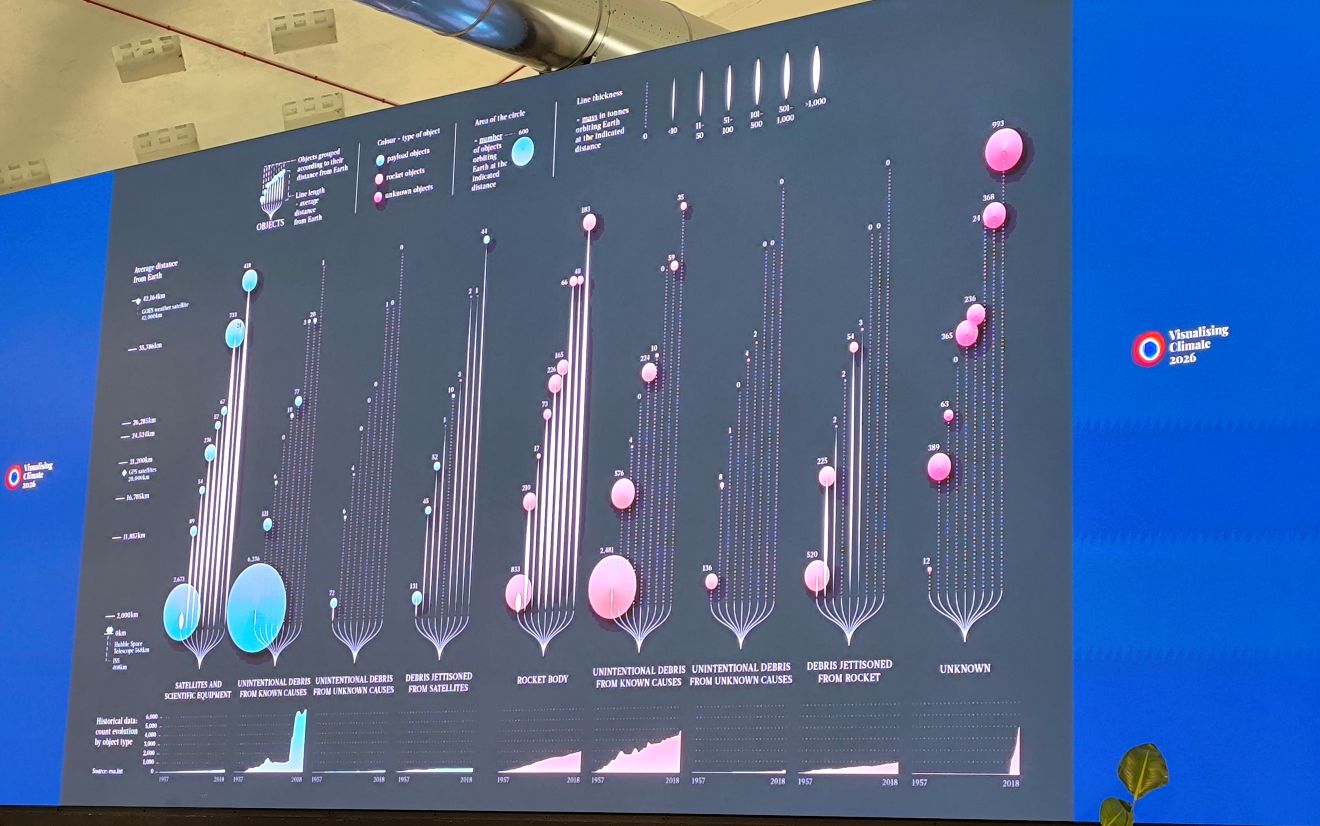
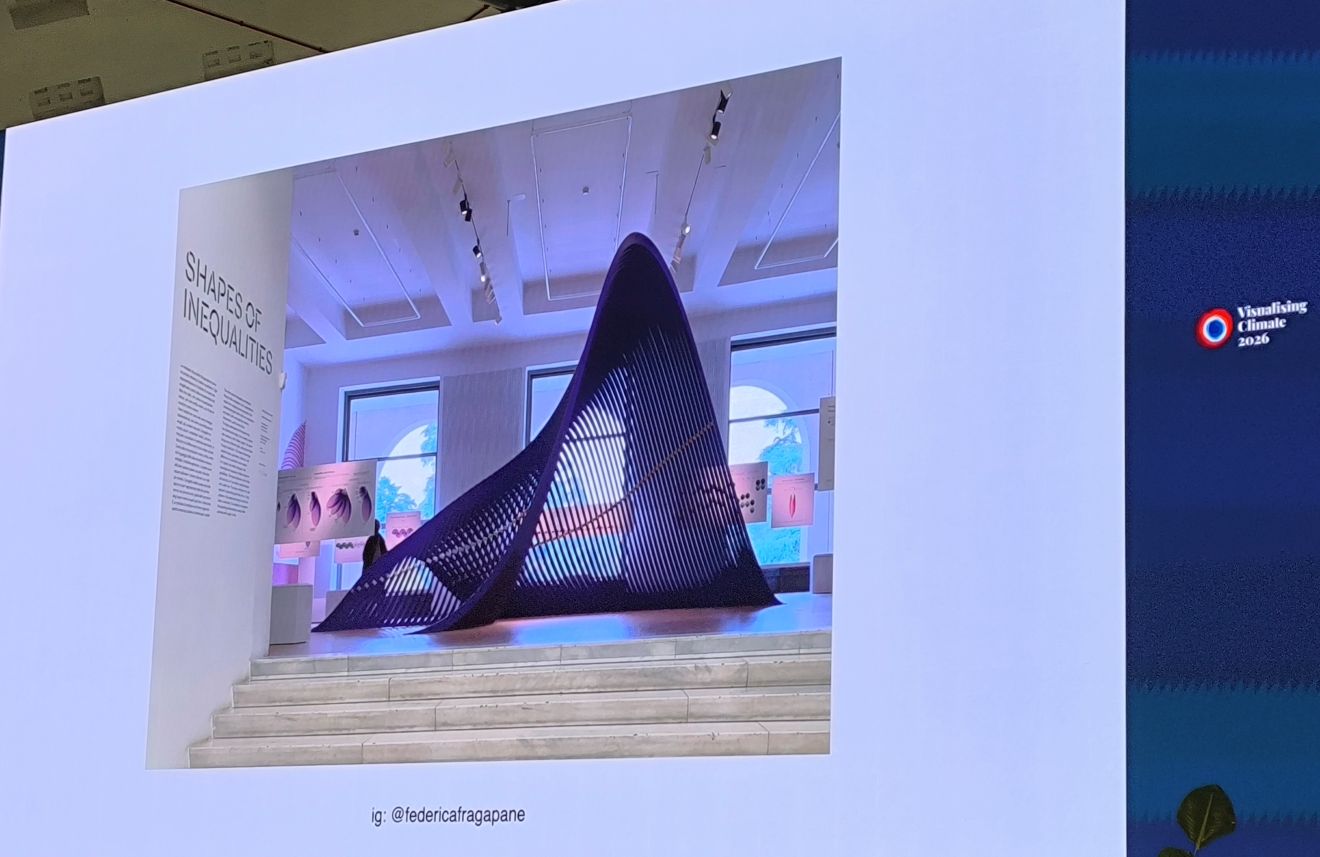
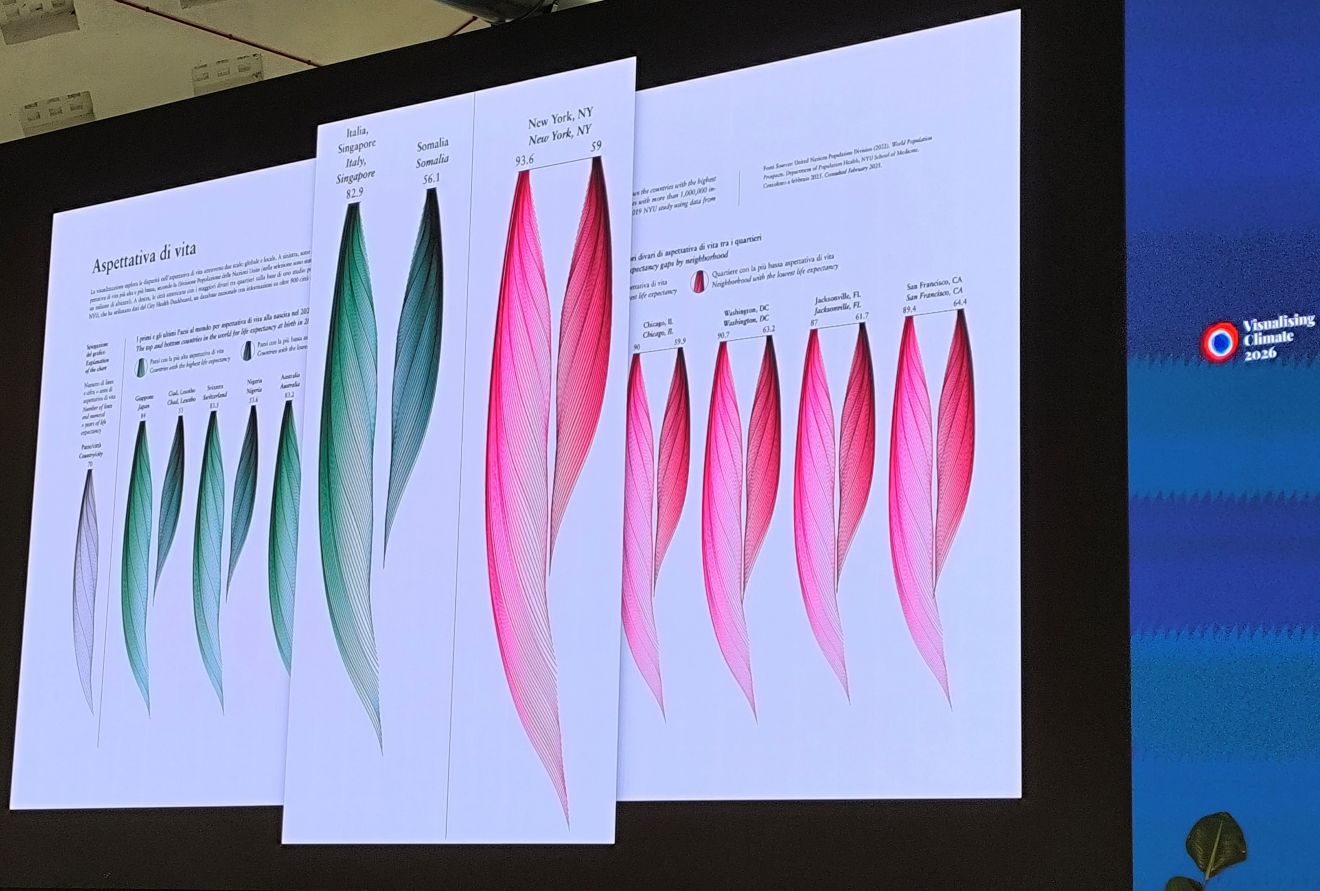
Federica Fragapane showed how even the smallest datasets can become beautiful visual stories through her organic approach to data visualization.
Elsie Lee-Robbins explored the idea of functional art through her linocut data visualization postcards. Something to try out yourself!
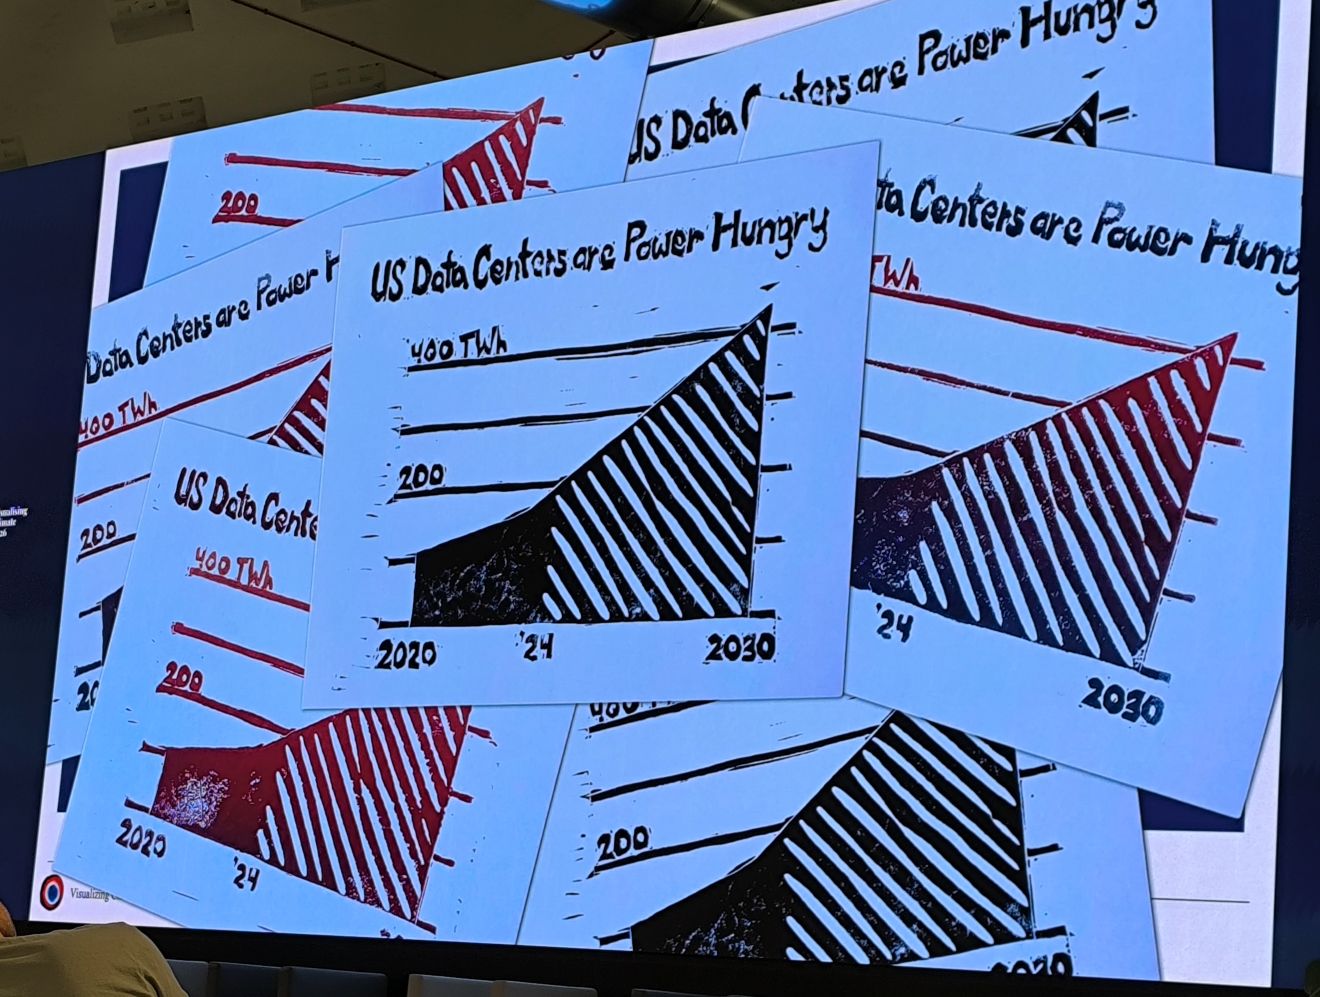
Both offered interesting perspectives on how data can be communicated beyond conventional charts and graphs.
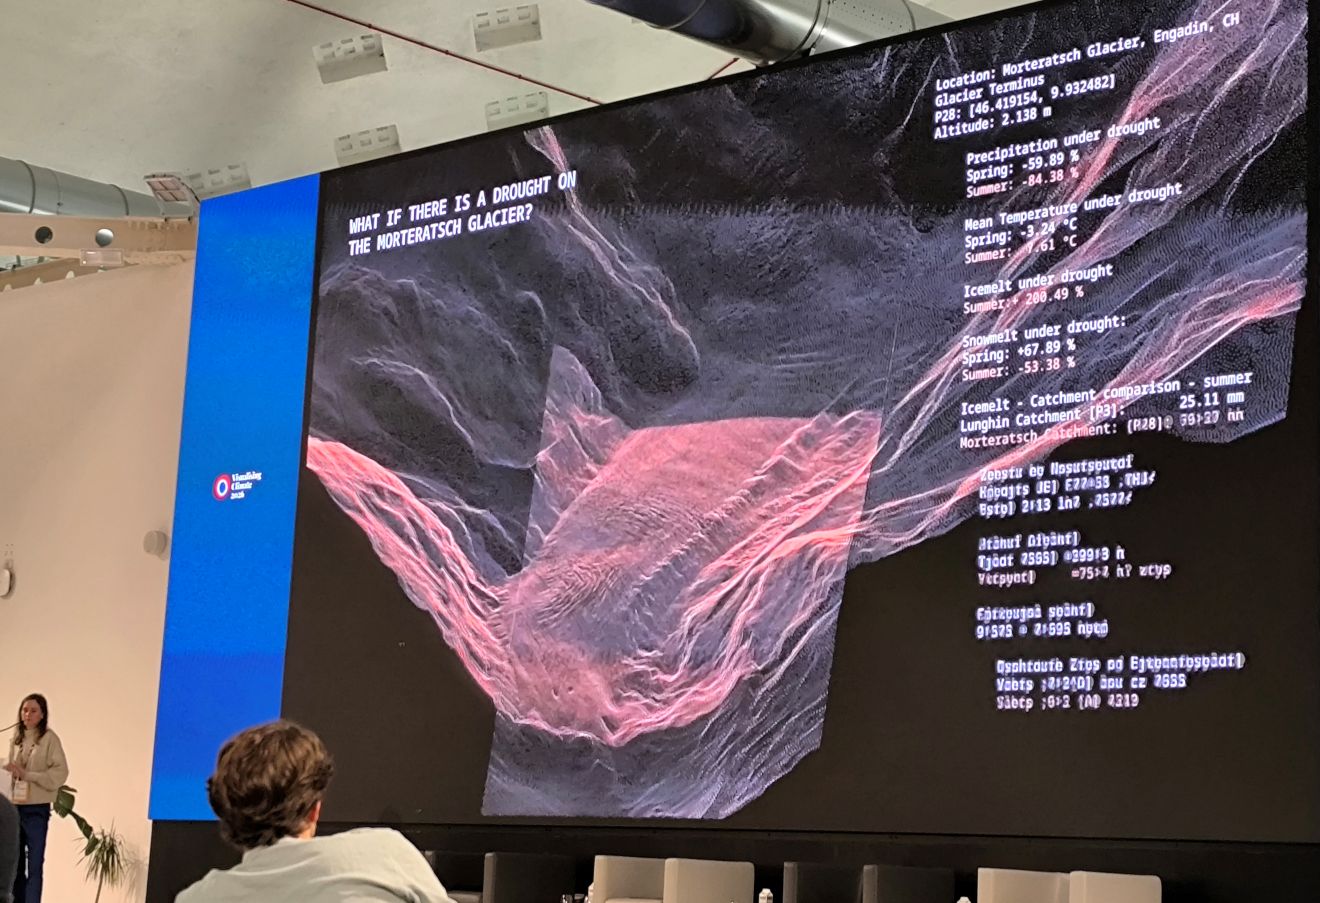
One quote stayed with me: “Data is informative, art is engaging.”
Perhaps we need more art if we want to inspire action?
Art can take many forms. It can let us look at familiar things from new perspectives. It can provoke emotions and invite a reaction. These are qualities that are so important when communicating climate challenges.
Beyond the talks #
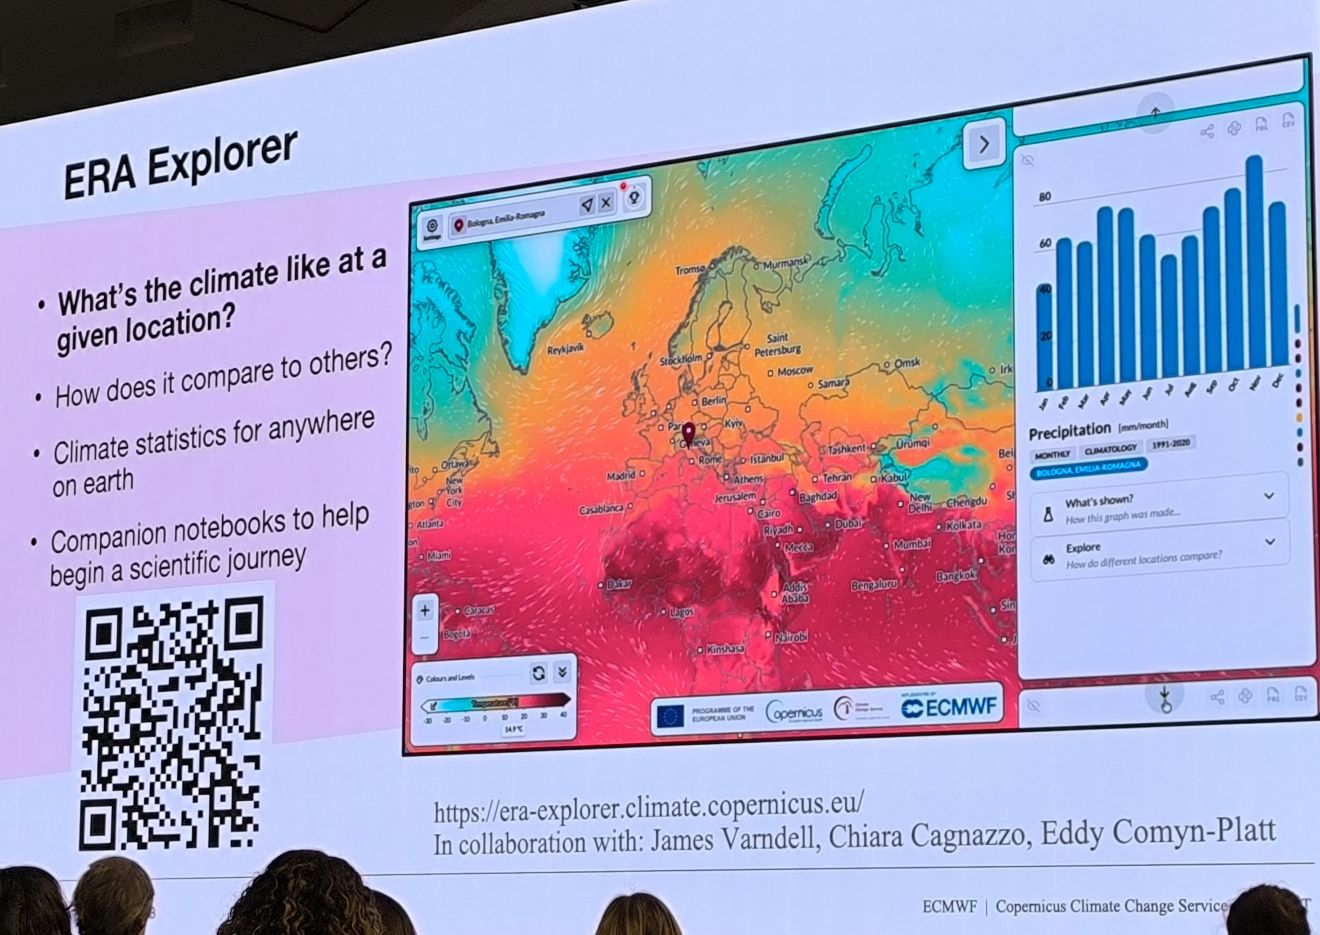
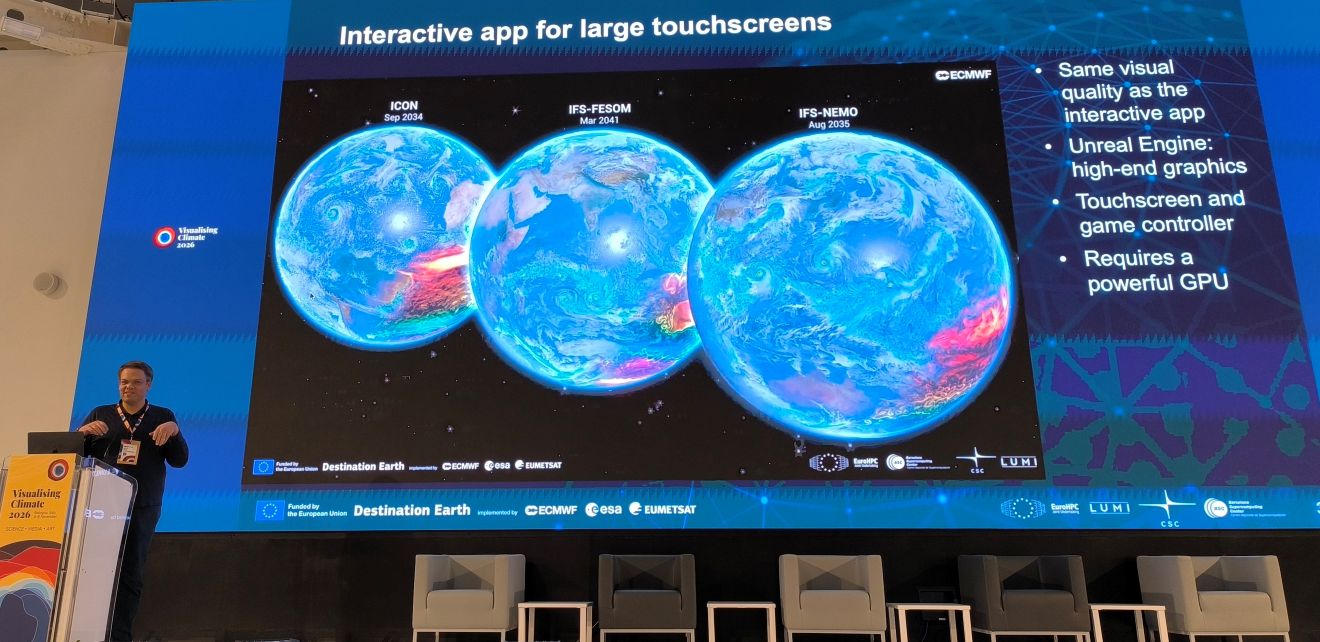
Other memorable moments included discovering ECMWF / C3S’s interactive applications for ERA5 reanalysis data,
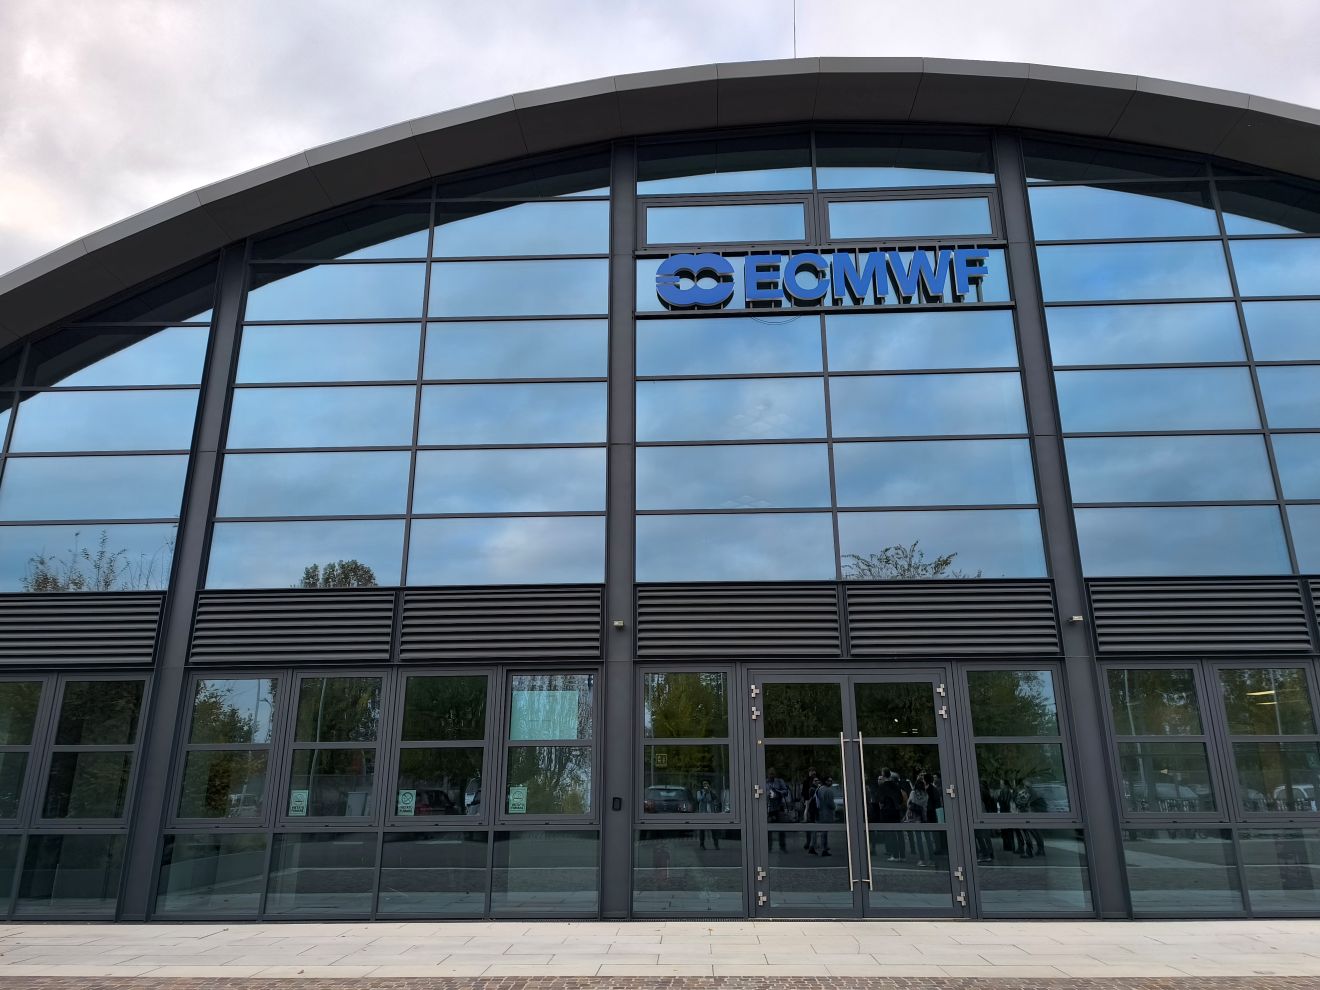
visiting the ECMWF Data Centre
and discussing the role of AI, creativity and critical thinking.
These conversations also brought me back to a broader question: what role should scientific institutions play in communicating their research?
I believe they should put more emphasis on data visualization and creative communication. Providing open data is important, but making data available is only part of the picture. Scientific institutes also need to communicate their findings and the challenges we face in ways that connect with people, make them care and encourage action.
I’m leaving Bologna inspired, with plenty of ideas to bring into my own visualization work, for coming projects. And I’m taking with me the memory of a very welcoming data visualization community and a wonderfully organized conference.
Thank you to everyone involved!